


Golf and investing share a similar lesson: anyone can have a great shot occasionally, but it’s the steady, consistent performers that win over time.”
I’m not much of a golfer anymore, but back in the day I could really hit the long ball—occasionally outdriving those in my foursome by 50 yards or more. The problem was that I could not do it with regularity. My long and middle-of-the-fairway tee shots were increasingly blended with tree-bound slices and 50-yard shanks. I wasn’t alone; consistency, or lack thereof, is what separates the professionals from the amateurs and total hacks like me.
The USGA publishes an annual report that examines driving distance on major tours for pros and at the local country clubs for amateurs. Being one who enjoys a good data deep dive, this report has piqued my interest. Last year, the pros averaged over 300 yards off the tee with a standard deviation of just 24 yards—nearly a perfect (and steep!) normal distribution.
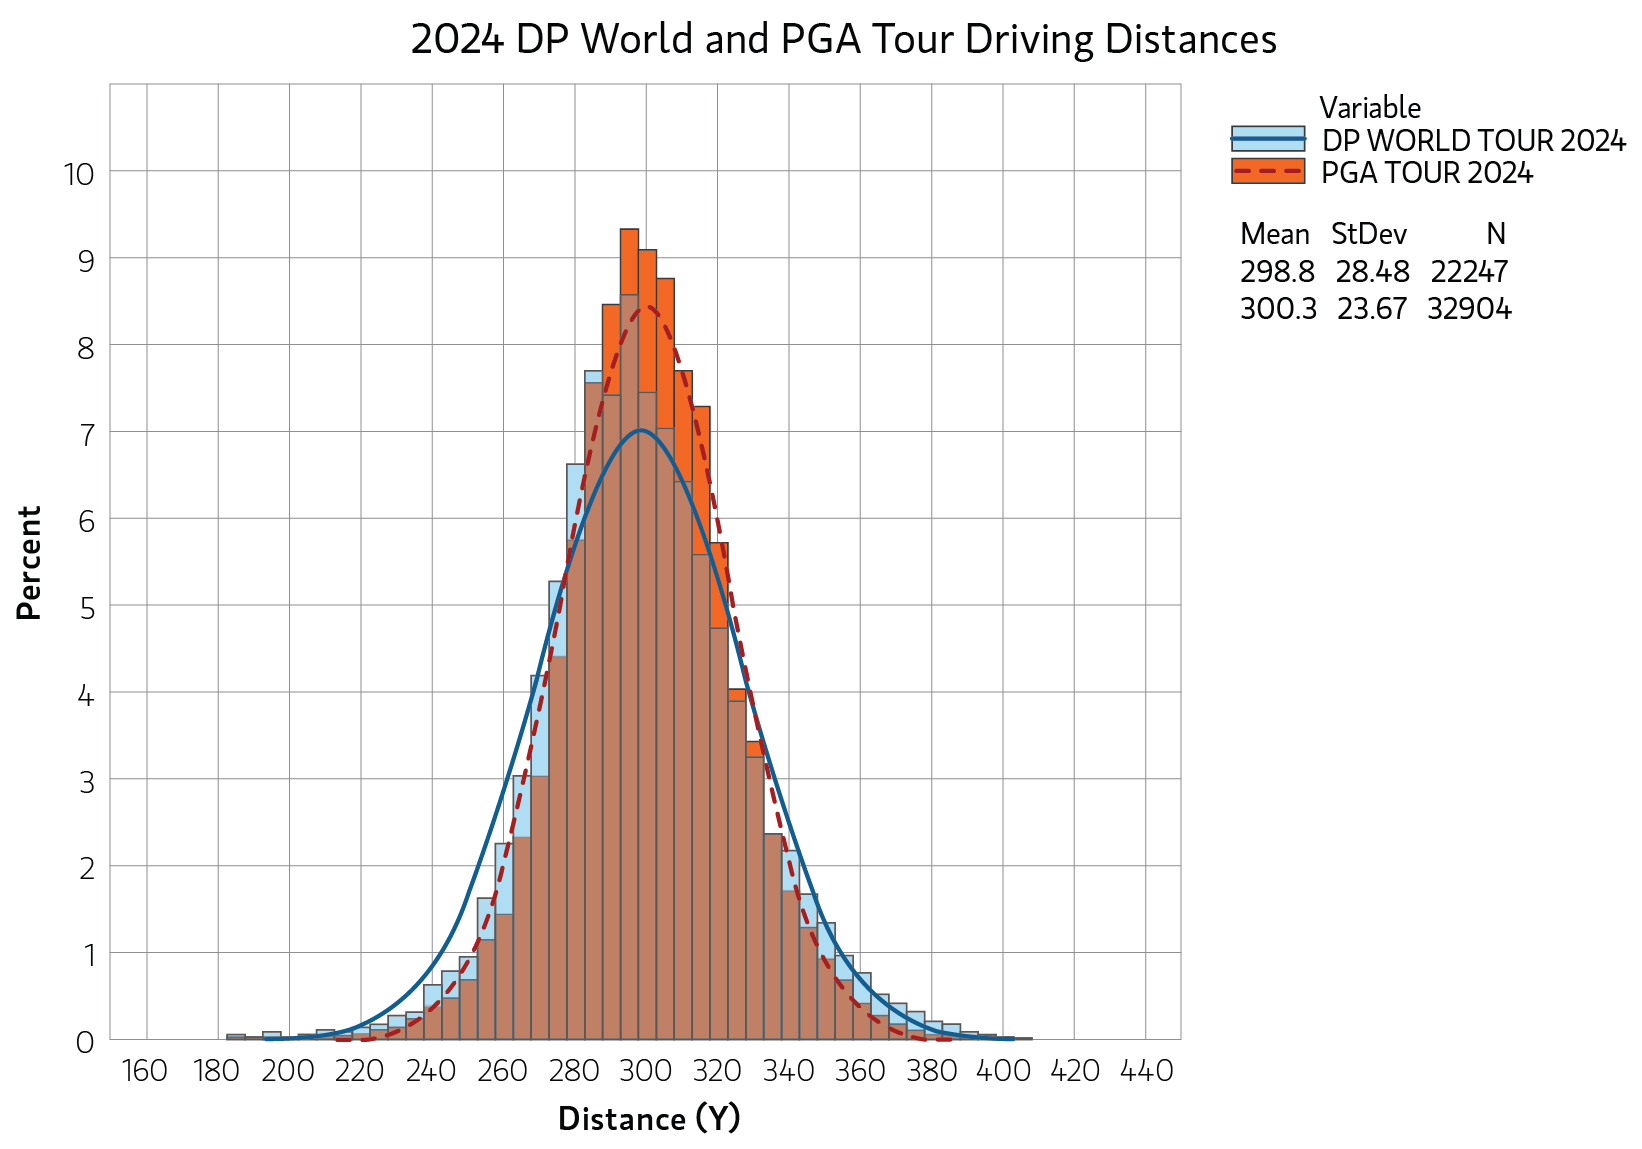
DISPLAY 1
Poor consistency equals poor performance
The amateur data, broken down by handicap, paints a more interesting picture. The top amateurs—those with a handicap below six—averaged a driving distance of nearly 240 yards, with a remarkable long shot of 335 yards. That shot alone would land in the top ~15% of drives in the PGA! So, why isn’t the long driver on the Tour playing alongside Justin Rose? Most likely it’s because they can’t hit 335, or anywhere close, consistently. Instead, once the slices, hooks and shanks are factored in, the average drops to over two standard deviations below the mean pro drive. Golfers with handicaps in the ranges of 6 to 12 and 13 to 20 had similar longest drives as the sub-six group, yet their average distance declined by about 20 yards in each step down. Again, consistency is the difference.
Sussing out the “pro” investments
It is the rare stock that can deliver reliable, steady growth and market-beating, long-term performance. By applying progressively stricter performance filters to the Russell 1000® Index over the past 10 years (2015 to 2024), we identified stocks that were the consistent performers, eventually winnowing 622 to 26 standouts, worthy of the pros!
Golf and investing share a similar lesson: anyone can have a great shot occasionally, but it’s the steady, consistent performers that win over time. Let’s apply our golfing analogy to the 622 stocks that were constituents of the Russell 1000® Index from 2015 to 2024.
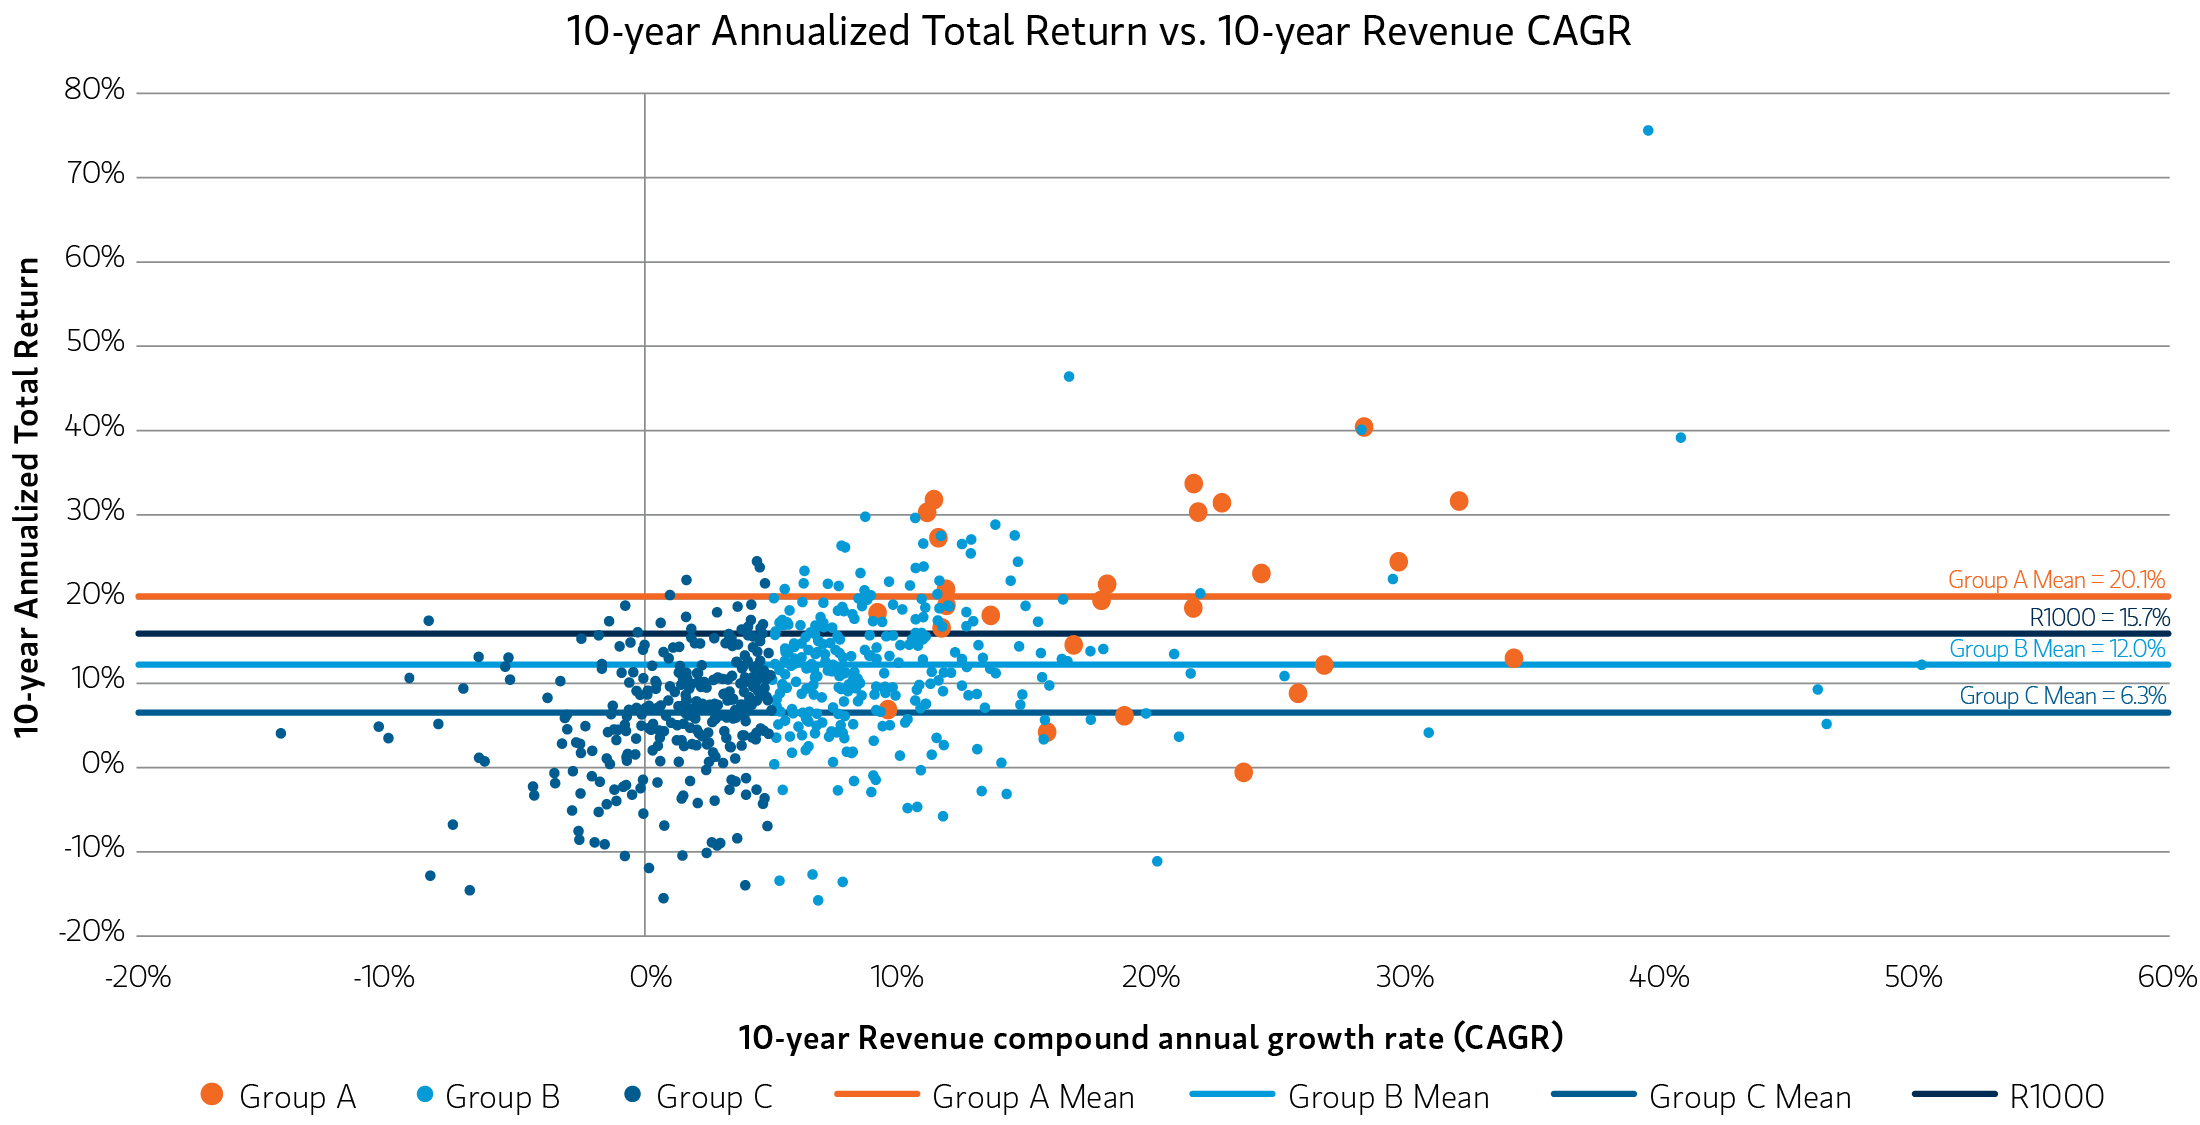
DISPLAY 2
The duffers…
Of these 622 stocks, nearly half (303) failed to deliver a revenue compound annual growth rate (CAGR) of 5%. Some had a few good years but delivered subpar results on average. The average annualized return of this group (Group C in dark blue) was just 6.3% over the decade, compared to 15.7% for the Russell 1000 index.
The club amateurs…
Of the 319 remaining securities, a promising 293 of them delivered a revenue CAGR greater than 5% for the decade (Group B in light blue). Though some bad years are mixed in, they were still able to achieve a better growth rate, on average, than the Russell 1000, and their average annualized return of 12% reflects better performance. A few of these companies might be ready to play in next Pro-Am tournament, but most have more work to do.
The pros…
Let’s now add consistency in the mix and find the pros! Just 26 stocks (Group A in orange) delivered not just a revenue CAGR of 5% over ten years, but 5% revenue growth in each and every year of the decade, akin to hitting a 300-yard drive at every non-dog leg par four and par five over the 18 holes. This group’s annualized return was over 20%, on average, besting the Russell 1000 by over 400 basis points. These are the true professionals that we aim to include in our strategies.
Our style of growth investing
As growth investors, we believe today’s market calls for an actively managed approach. We look for companies demonstrating consistent growth across diverse market conditions, a strategy we think ultimately delivers steadier returns and a less volatile ride for our clients. We evaluate stocks with an eye towards attributes such as rapid innovation, strong leadership and stable strategies to help identify companies that can deliver consistent growth. We’ll get into that in our next blogpost on the back nine.
Bottom line: Our experienced team employs an active approach to investing in U.S. large cap companies participating in long-term secular growth trends, with an emphasis on seeking the pros with consistent results.
Featured Insights